Export marketing activity data—including email interactions, form submissions, and inbound webhook submissions—directly to your CDP or data warehouse. From there, use your analytics or business intelligence tool to analyze and report on the influence marketing activities have on down-funnel conversions like product activation, free to paid conversion, and/or closed-won opportunities.Read more about configuration details in our docs:Export to Data WarehouseSegment (Segment as a destination)
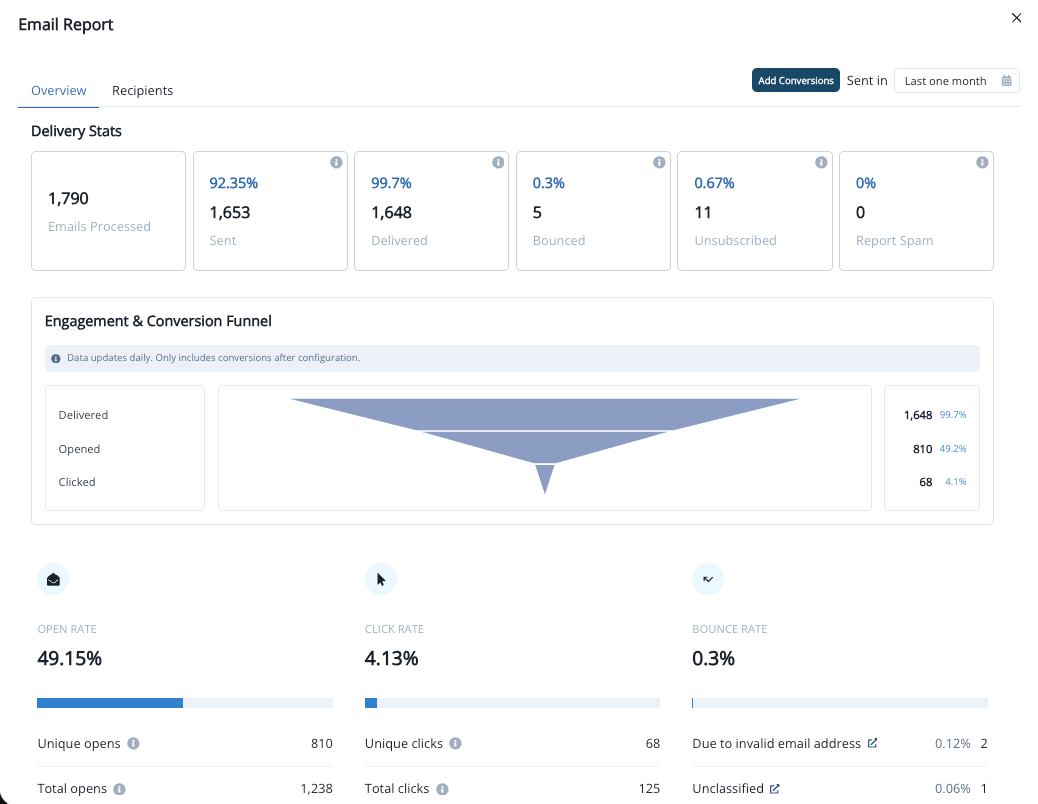
The Journey Email Report summarizes email performance for the entire journey for a given time period (defined in the top right corner).
The timeframe (top right corner) will default to the Last one month. To view metrics for the complete life of the journey, update the timeframe to All time.
There are two tabs in the Journey Email Report.
Overview
Note that the Overview tab describes metrics across all emails and contacts (or users) in the journey. (If 50 contacts qualify for a journey and there are 2 emails in the journey, the Overview tab will show up to 100 emails processed, opened, clicked, etc.)
Delivery Stats summarizes email metrics such as sent, delivered, bounced, unsubscribed, opened, clicked. etc.
These numbers reflect email sends, not unique contacts or users. If a single contact or user is sent 2 emails, they (and their relevant activity) will be counted for each email sent.
Opens are counted once per contact per email. If a contact opens the same email several times in a short window, it counts as one open.
Top Links displays the most frequently clicked links across all emails. Click to View all links for a complete list.
Email Clients shows what share of opens and clicks come from which email client.
Past journey runs: each row represents a cohort of users or contacts who qualified for the journey on that journey run.
Like the overall delivery stats, each row reflects all emails sent to the cohort and activity related to those emails; rows do not represent unique contacts or users.
In multi-email journeys, each row will update as the cohort is sent and interacts with additional emails from the journey.
In the above example: contacts added to the journey on August 18 were sent 9,433 emails. As there are multiple emails in this journey, this number is not an indication of the unique contacts added to the journey on this day. Instead, it represents the total number of emails sent to the cohort of contacts who entered the canvas on August 18. FINISHED indicates all contacts have exited the journey. IN PROGRESS (on the August 19 row) indicates all contacts have not yet exited the journey.
Note that if the journey starts with a delay step that is 1+ days, the first rows may show 0 emails processed. This is because the most recent cohort who entered the canvas will not receive emails until after the delay step.
To understand how many emails were sent in a given day, return to the top of the report (Delivery stats) and filter the time period to the date.
Recipients
All: lists all contacts evaluated for a send.
Not sent: lists contacts who were evaluated, but not sent to, and the not sent reason (typically due to unsubscribe, communications limits, or past bounces).
Tabs Open, Click, Bounce, Unsub, and Spam list the contacts relevant to these activities.
Security scanners, link checkers, and other automated tools can open emails and click links. This inflates open and click counts. Inflection detects this activity and flags it as bot activity.Every open and click is evaluated against several independent signals. No single signal decides the outcome; they are weighed together, and each event is either flagged as a bot or left unflagged - a single yes/no marker.Signals we use:
Datacenter-origin IPs. Genuine human engagement almost always originates from residential or mobile networks. Requests coming from datacenter IP ranges (where proxies, scanners, and bots run) are a strong automated-activity signal.
Repeated-link scanning. A person typically clicks one, maybe two links in an email. An actor that follows many distinct links from the same message in a rapid burst is a security/link-protection scanner, not a reader.
Multi-recipient IP fan-out. When a single IP fetches tracking content for a large number of different recipients, it is acting as a shared proxy or scanner rather than an individual.
Client identity. The mail client / user agent distinguishes real interactive clients from scripted fetchers and known proxy services (e.g. Apple Mail Privacy Protection, Gmail image proxy).
To hide flagged activity, click Exclude bots next to Bot filter at the top of the Email Report. Off is the default and shows all recorded opens and clicks. The filter applies to opens and clicks together across the report.
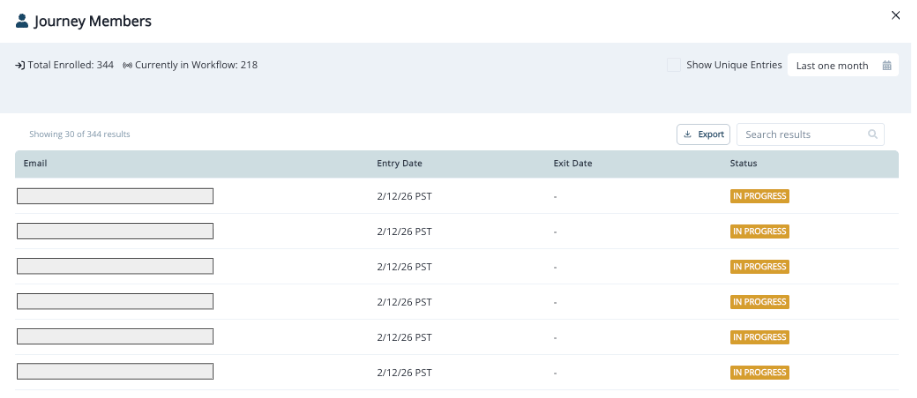
This report lists all contacts or users who entered the journey, with the following details:
Entry date
Exit date
Status
Search for specific contacts or users to understand when the person entered, exited and their current status in the journey.Export the report to analyze details in a spreadsheet.In the case the journey is set to qualify contacts or users more than once, select Show unique entries to only display the most recent run of a user or contact.



 Note that if the journey starts with a delay step that is 1+ days, the first rows may show 0 emails processed. This is because the most recent cohort who entered the canvas will not receive emails until after the delay step.To understand how many emails were sent in a given day, return to the top of the report (Delivery stats) and filter the time period to the date.